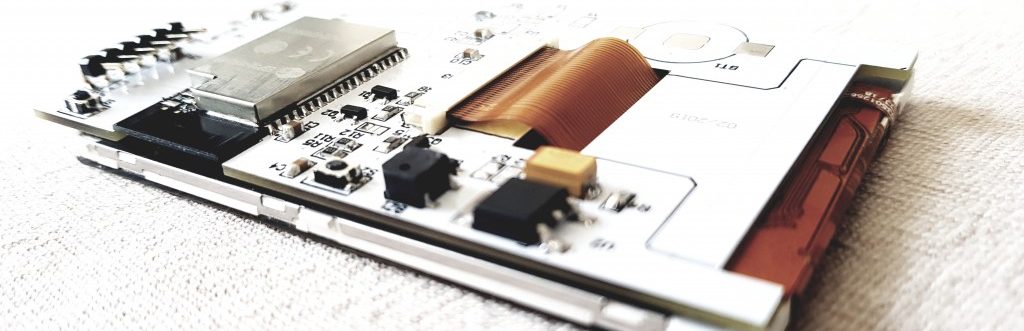
I have one of the cheap DX digital thermometers laying around with the thermistor removed and used in another project. So I got an idea to try: use the LCD screen for visualizing data.
The unit is driven by a thermistor: a variable resistor that changes its resistance in relation to the temperature. So, I thought the easiest way to simulate variable resistor is by using a photocoupler. I have a Sharp PC817 that I could use for the purpose. The idea is simple: PWM the LED in the photocoupler to vary the resistance on the output side. here is my test setup:

I also added a yellow LED to visually see the PWM-ing. On the software side, I wrote a small program to PWM the PC817 and visualize the PWM value on the serial output. I’d then write down the PWM value and LCD readout to try to get some sense out of it.
/*
 Fade
 This example shows how to fade an LED on pin 9
 using the analogWrite() function.
 This example code is in the public domain.
 */

int led = 9;           // the pin that the LED is attached to
int brightness = 0;    // how bright the LED is
int fadeAmount = 5;    // how many points to fade the LED by

// the setup routine runs once when you press reset:
void setup()  {
  // declare pin 9 to be an output:
  Serial.begin(9600);
  pinMode(led, OUTPUT);
}

// the loop routine runs over and over again forever:
void loop()  {
  // set the brightness of pin 9:
  analogWrite(led, brightness);

  // change the brightness for next time through the loop:
  brightness = brightness + fadeAmount;

  // reverse the direction of the fading at the ends of the fade:
  if (brightness == 0 || brightness == 255) {
    fadeAmount = -fadeAmount ;
  }
  // wait for 30 milliseconds to see the dimming effect
  delay(10000);
  Serial.println(brightness);
}
So running the program I was the LCD change values from -42 to +28.5 (strange, it should go higer, but II think it is due to the 220ohm current limiting resistor I had on the Yellow LED)
I recorded the reading in Excel, so that I can then PWM the value to get certain LCD screen reading.
One way to use it, is to create a lookup table, and find the closest WM value for the desired LCD output. I also tried to find a function based on the output values using this neat tool for working out nonlinear regressions, the result was Y= 21.03584781* LN(X) – 90.53971398
I tested, but it is not so accurate, so I prefer the look up table option.
I also have a DS1803 digital potentiometer that I tested, it is a 0-100K dual channel variable resistor controlled over I2C and the readings were much more accurate, at the cost of more complicated hardware and software setup.
As a conclusion, it was an interesting test of little practical value other than displaying lets say temperature data for cheap.
I hope the idea helps someone 🙂