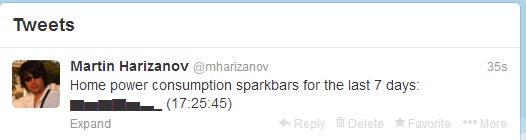
Sparkblocks are a text-only version of the sparkline charts, using just unicode symbols. These are a convenient way to represent trends in pure text, quite useful when you want to use SMS, tweets or even the subject line of an email to show a story. Those of you following me on Twitter may have seen recent tweets of mine that look like this:
Home power consumption for the last 7 days: ▆▅▆▇▅▃▁
Edit: I created a dedicated Twitter account for my house, folow it here:
Follow @iot_house
Here is how I did that:
First, I grabbed and installed a Python library for generating unicode text based sparkline bargraphs from lists of numbers. The Readme contains all you need to get the job done in 30 or less seconds.
Next, I registered with PushingBox – a neat service for cloud notifications. I created a simple scenario that would post a tweet with the sparkblocks for me, so that I keep my Python code as simple as possible:
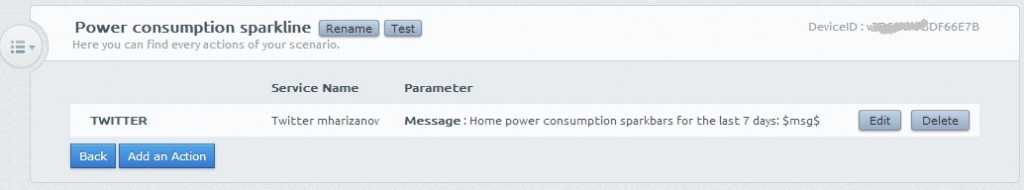
The scenario receives an unique identifier called “DeviceID”, write this down for later use.
I log my power usage to emoncms, storing my kWhd data in feed number 5. I will be fetching week’s worth of data from that feed, converting it to text sparkblock and tweeting it using a simple Python script:
#!/usr/bin/python
import time
import urllib
import json
from sparkblocks import spark #https://github.com/1stvamp/py-sparkblocks
import urllib, urllib2
from urllib import quote_plus

API= "**********API***********" # emoncms API key
feedID=5                                # emoncms feed id that contains the kwh/d data
deviceID = "****DeviceID******"   #PushingBox deviceID

sec_per_day = 60 * 60 * 24
end = (int(time.time()))                 #now
start = (end - (7 * sec_per_day))        #7 days ago

data_url = "http://emoncms.org/feed/data.json?apikey=" + API +"&id=" + str(feedID) + "&start=" + str(start*1000) + "&end=" + str(end*1000) + "&dp="

#urllib's urlencode doesn't take utf8, so use a custom one
def urlencode_utf8(params):
    if hasattr(params, 'items'):
        params = params.items()
    return '&'.join(
        (quote_plus(k.encode('utf8'), safe='/') + '=' + quote_plus(v.encode('utf8'), safe='/')
            for k, v in params))

def pushingbox(key,val):
    url = 'http://api.pushingbox.com/pushingbox'
    values = {'devid' : key, 'msg' : val}
    try:
      data = urlencode_utf8(values)
      req = urllib2.Request(url, data)
      sendrequest = urllib2.urlopen(req)
    except Exception, detail:
      print "Error ", detail

# read in the data from emoncms
try:
        sock = urllib.urlopen(data_url)
        data_str = sock.read()
        sock.close
except Exception, detail:
        print "Error ", detail

data = json.loads(data_str)

x=0
sparkval=[]     #A list to hold the sparkline values
data.reverse()  #Reversed order, as we want newest data last in the sparkline
for i in data:
        sparkval.append(float(data[x][1]))  #first parameter is the timestamp, ignoring it
        #print float(data[x][1])
        x+=1

pushingbox(deviceID,spark(sparkval))
Finally, I set a cron job to run this every Sunday just before midnight.
Neat, right?
Pingback: In-memory SQL analysis of emonCMS feed | Martin's corner on the web