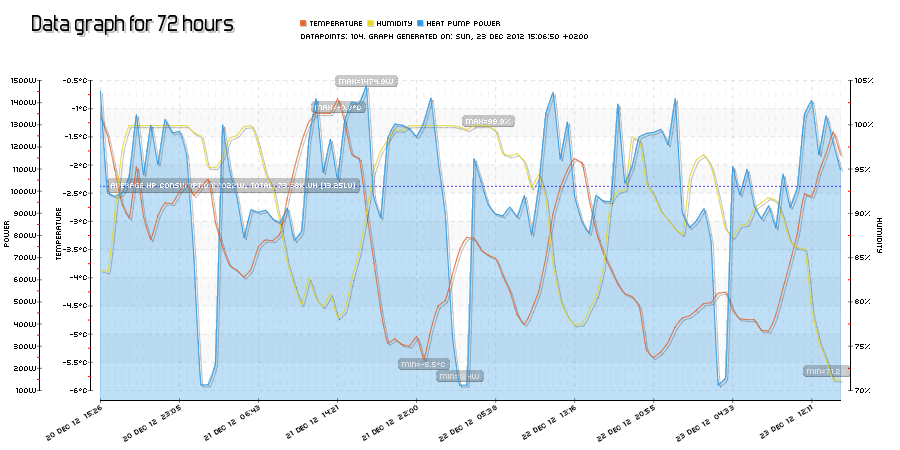
pChart is a neat PHP charting tool, I have been using prior to switching to emoncms. Emoncms has multigraphs available, that are much more interactive, but they are slow too. I also have had some issues with certain feeds that just won’t visualize and never got to the bottom of the problem. I missed my good old charts so decided to make them work with emoncms. The challenge here is that data is being fed at different rates in different tables, so some data ‘massaging’ is necessary before it can be used for charting, I experimented with three feeds of different types, pretty much still hard-coded stuff. It renders under a second, looks pretty too. My old tool had period selection and choice of what data to plot, I will probably add that at some point later.
The output is a .png file, pretty easy to embed too.
The PHP code is available on github.


Pingback: Using my 1.8 TFT as a Raspberry Pi status display | Martin's corner on the web
Pingback: Martin's corner on the web