Having the heat pump in place, I decided that the next logical step is to be able to monitor its performance. The reasons behind that are simple
1) It is a home made hack job, not a ready product so I had to measure the effect of having it and this prove it efficient or not
2) I can have constant data logging and monitoring
3) By monitoring it, I can identify problems and address them
I came up with an action plan with the following steps
1) Decide what to monitor
2) Decide how to monitor it
3) Decide how to store the data
4) Solution on how to visualize it
5) After some data is in, analyze the data
6) Use the analysis make corrections
Deciding what to monitor was relatively easy, most important for me was monitoring the power consumption, hot water tank temperature, heat exchanger returning water (cold) temperature, heat exchanger cold refrigerant temperature, hot water tank hot refrigerant temperature, hot boiler tank exit refrigerant temperature, outside temperature. I’d love to be able to monitor the heat pump’s COP, but that is not quite easy in my setup where the refrigerant circulates in the hot water tank before ending up in the brazed plate heat exchanger. There is phase transition involved in the process and that no spoon for my mouth.
Next important step was deciding how to monitor all this. After quite a googling I decided that most accessible for me was to use an Arduino for the purpose, so I purchased one. I have never before that worked with microcontrollers and that was a nice learning experience for me. For temperature measurements I experimented with thermistors and, but then I need one Arduino analog pin per thermistor and I gave up. Next option was to use a digital temperature sensor, the seller had TCN75A in stock so here I was purchasing a bunch. The sensor runs on I²C bus, quite a pin saver. They are pricey though, and for my future plans I will use the DS18B20 Programmable Resolution 1-Wire Digital Thermometer. Last step was to figure out the power consumption sensing and I then found this article on how to build Arduino based energy monitoring system. The guys at openenergymonitor.org have been an inspiration ever since. It took a while to get all components shipped, assembled, wires put in place and software written.
Having the hardware and software in place, I was able to read live data from the sensors thru the Serial output of the Arduino and an I²C 16×2 LCD display. That’s fun, but for a short time 🙂 It is necessary to store that data because only analysis it time is useful to me. I decided that it will be best to store the data online; For the purpose I purchased and ethernet “shield” so that my Arduino was now Inernet-connected. On the software side, my research showed pachube.com as one of the possible options. I did some preliminary research, but decided to build my own MySQL/PHP based system; In fact it is quite an easy job to serve HTTP GET requests and store them in the database. I send my data every 15 seconds, that since Dec 15th 2010 when I had all this in place. Eventually, I decided to add an extra CT and a remote Arduino equipped with XBee radio module to monitor the overall house power consumption on top of the heat pump’s.
 Here is a shot of the early breadboard prototype running tests.
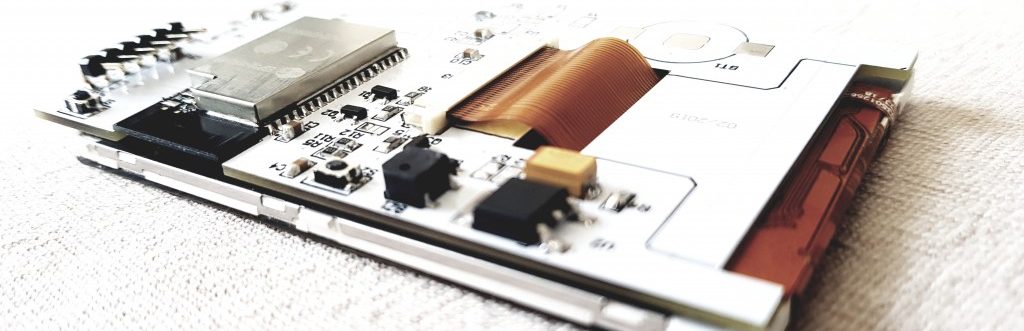
 After a while that wires mess started to be quite annoying and put the whole project in a box, looks a bit better although the mess remained inside the box :). All this motivited me to lay out a dedicated sensing PCB, I will be describing my progress on that subject soon.

.. and the project box (ignore the lousy screen-cut job, first time attempt)
Having the data stored, I had to figure out a way to visualize it. I decided to use PChart , a PHP charting library for the purpose, quite a nice one indeed. Here is how it came out; note that when data is missing, that is also visible:

There is also a UI that allows me to filter for a period, apply resolution and chose what to draw:

So I was finally able to view performance data, analyze it and make corrections when needed.
Overall, I gained lots of experience with this project, quite happy with the results as well.
hi martin. i want to thank you for sharing your work! all article were very interesting to me, specially your trick of how to allow newsoftwareserial run in attiny84 that i used for attiny85!
now i would ask you about your own MySQL/PHP system for catch HTTP GET requests. please, could you tell some example details or references links that allow you to code it.
best regards, pescadito.
This was in-house project that I abandoned in favor of EmonCMS, see here http://openenergymonitor.org/emon/emoncms
Pingback: pChart-ing emoncms data | Martin's corner on the web
Pingback: Using my 1.8 TFT as a Raspberry Pi status display | Martin's corner on the web
Very interesting! I was looking for this information and I found it on your website.
I have some questions.
1. What is the sampling of the data?
2. is it possible to have the raw data for this measurements or if you have any additional measurements?
I am trying to figure out if the operation of the heat pump produces periodic pulses (like a typical air conditions). If you know the answer pls let me know.
I will be glad if you could share with me the raw data for this period with sampling rate <30 secs so as to processe them and observe the nature of the power footprint of the heat pump.
Thanks,
George
Hi,
I collect various data every 30 seconds; The data is stored in MySQL tables here is an extract with 20000 of the most recent.
If your heat pump is iverter, it adjusts its power according to the need. Otherwise it will do pulses.
http://harizanov.com/wp-content/uploads/2013/04/datalogger.csv.zip
the sensor name are are as follows:
Sensor1Name Heat Pump Power consumption
Sensor2Name t boiler
Sensor3Name t H/E – cold water
Sensor4Name t outside
Sensor5Name t H/E – cold freon (not collected)
Sensor6Name t hot freon boiler
Sensor7Name t cold freon boiler
Thanks Martin!
from the data I observe that the heat pump varies between 0 and 1800 Watts approx. This means that the labeled power characteristic of your heat pump is approx 2000 Watts?
If you can pls let me know about the mark and model of your heat pump to better understand what is happening in reality compared to the label power values described on the heat pump.
Thanks in advance,
George
Hi,
read all about it here: http://harizanov.com/2012/03/hacking-daikin-split-type-air-conditioner-into-air-to-water-type-heat-pump/
I keep it in ‘night mode’ that keeps the max power to 1/2, it easily revs up to 3600W otherwise, but I don’t need rapid heating, rather continious, low-power mode.
Pingback: Designing a General Purpose Heat Pump Controller - Page 2 - EcoRenovator