I have been experimenting these days with a clear-sky curve for our PV system in Home Assistant. I wanted to see what the system would produce right now with no clouds, drawn on top of what it actually produces, as a baseline to compare against. On a cloudy day the production graph alone tells me almost nothing, I cannot see if the sky is bad or if I have dirty panels, a weak string or the inverter derating.
Forecast.Solar was no good for this as it has the weather in it. My HA recorder has 3.3 years of hourly data from the Fronius GEN24 (28,592 rows), so I decided to use the array itself as the model.
Fitting the envelope
Clouds only ever subtract. If I bin three years of hourly output by sun position (elevation and azimuth), the top few percent of each bin is what the array does when nothing is in the way, the clear-sky envelope. To fit a model to that envelope I need to calculate a few things. First the irradiance at the top of the atmosphere, with the annual distance term. Then the air mass the sunlight has to go through, from the sun elevation, and the direct beam, attenuated by a seasonal extinction coefficient. Then a diffuse term, the transposition onto the panel plane, and at the end a temperature derate and a DC clip.
E0  = 1361 * (1 + 0.033*cos(2pi*(doy-3)/365.25))         solar "constant"
AM  = 0.918 / (sin el + 0.50572*(el + 6.08)^-1.6364)     airmass, 720 m altitude
tau = 0.1122 * (1 - 0.469*cos(2pi*doy/365.25) - 0.010*sin(...))
DNI = E0 * exp(-tau * AM^1.48) * horizon(az)             direct beam
DHI = 0.1394 * E0 * (sin el)^0.6                         diffuse
POA = DNI*cos(AOI) + sky + ground terms                  panel plane, tilt 15deg, az 205deg
P   = min( 4.89 * POA * (1 - 0.0038*(Tamb + 0.032*POA - 25)), 6081 W )
That is eleven parameters and I fitted all of them from the data, I never measured the roof. The fit even found the horizon, about 6° east and 4.6° west, matching the terrain here, and a seasonal extinction swing with the winter air roughly twice as transparent as the July haze. Here is my Python code if someone is interested: fit_clearsky.py
Then I checked it against the 29 clear days in the dataset. The model is within about 176 W of the actual production for any given hour (roughly 6%) and errs slightly high, which is fine for a ceiling. The best day of every month lands between 0.94 and 1.01 of the ideal curve, so it works in January and in July. All of it compiles into one template sensor (the Jinja version agrees with the Python one to 0.2 W), and I backfilled the statistics to January, so the overlay works back in time too.
What it shows
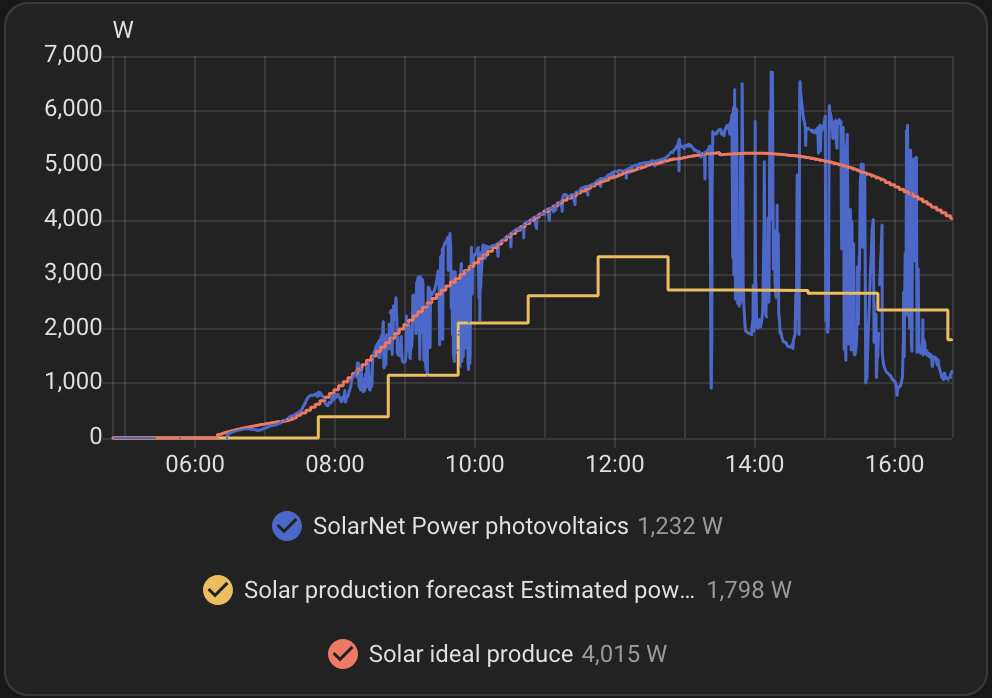
Here is July 27th. From 10:10 to 13:25 the two curves were glued together, 5041 W actual against 4994 W ideal at 12:25, so a clear sky for sure. Then clouds rolled in and the actual output dropped to 1700 W, while the ideal line kept going along its arc.
For a single number there is a clearness index sensor (actual/ideal) as well, 97% on a clear day and 23% in the afternoon murk.
What I did not expect were short spikes above the ideal line when the sun comes back after a longer cloudy spell. At one point I saw 5830 W against a 5140 W clear-sky ceiling, 13% over. I think there are two effects that add up:
- Cloud enhancement. Droplets scatter light almost straight forward, so a cloud edge near the sun acts as a second light source on top of the direct beam. There is a 2025 paper that measured 10–60% over clear-sky from it.
- Panel temperature, and this one I could verify from my own data. The panels cool toward ambient while shaded, and cool silicon is better silicon. The MPPT voltage shows it, 294 V during the cloudy spell, 277 V when the sun burst through, then settling to 271 V over the next twenty minutes as the cells warmed back up. Reading that voltage decay as a thermometer, the panels were 15–20 K cooler when the sun returned, worth 300–400 W of temporary bonus at the −0.38%/K coefficient the fit found.