
I started collecting electricity usage data in April 2012, and wanted to check how am I doing this year compared to last year. Of course, as of today, only few months overlap (May-August), but still that will give me some idea if all my energy use optimizations have effect.
I started by exporting the daily kWh feed to Excel, then I added few more columns to aid me in pivoting the data: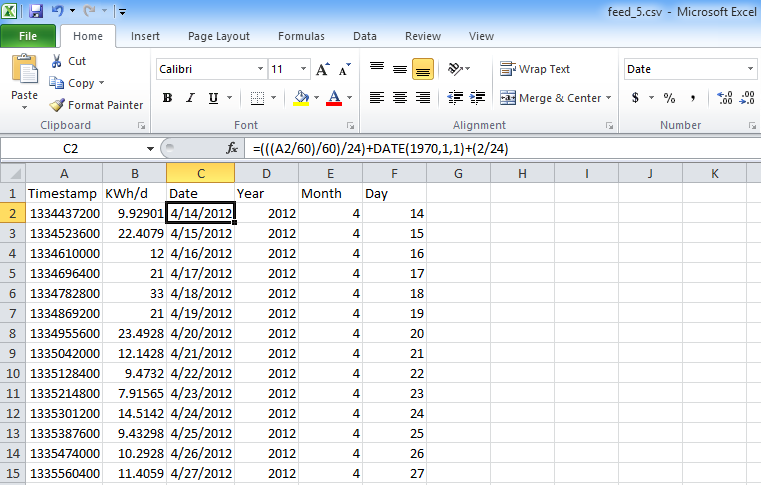
I then created a pivot table based on this data and added a chart that shows my power usage by month and by year: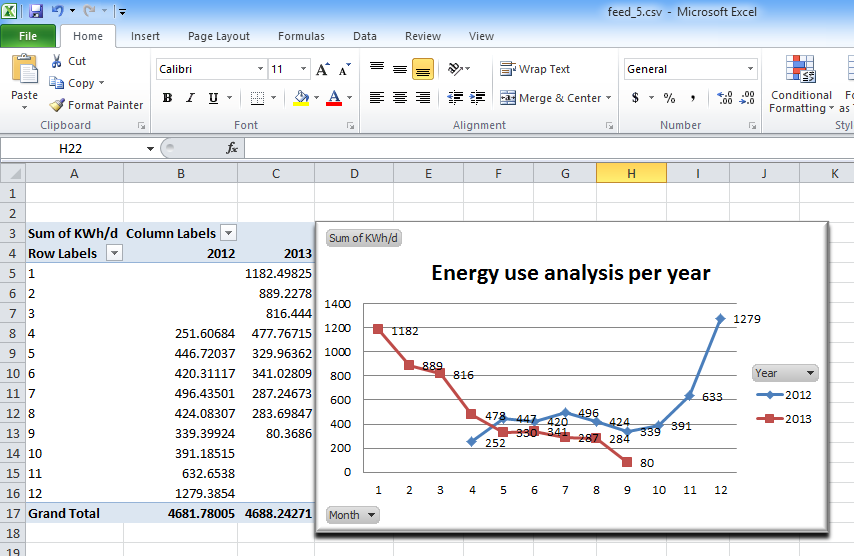
Again, since I only started collecting data sometime in April 2012 so that month’s data is incomplete, plus September 2013 is not finished yet. The rest of the data, where the 2012 and 2013 data overlap shows a clear improvement, that is no surprise to me as I have undertaken many optimizations. The house runs entirely on electricity, we don’t have gas or central heating.
It feels good to have measurable effect, I will run this sort of analysis in few months when I have complete two years of data collected.