I have been experimenting these days with the possibilities to calculate Sun’s position and the light intensity in kW/h that will be available for my 2.088m2 evacuated tube solar heater. I wanted to log this in emoncms and visualize as a baseline to compare against.
So to do this I need to know the exact location of the Sun for my location at any given time. I found a nice PHP script that can calculate Sun’s elevation and azimuth for given time, latitude and longitude, so with minor modifications and corrections I had this information.
My next step was to look up the correct algorithm so that I could calculate the light intensity that will reach a fixed solar panel with given orientation. My panel is tilted at 40 degrees and its azimuth is at 150 degrees (almost South). I found an excellent site that was very educational and had all the formulas I needed, including a JavaScript example. So to outline the calculations needed:
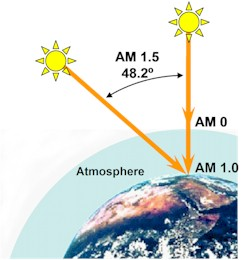
- I need to calculate the Air Mass that sunlight has to go through. The Air Mass quantifies the reduction in the power of light as it passes through the atmosphere and is absorbed by air and dust.
- Calculation the intensity of the direct component of sunlight throughout each day can be determined as a function of air mass , here is the formula and explanation
- Adjust for the orientation of my panel, here is the formula and explanation
- As a result of the above calculations I receive solar intensity in kW/h per square meter, I multiply this by the surface of my panel
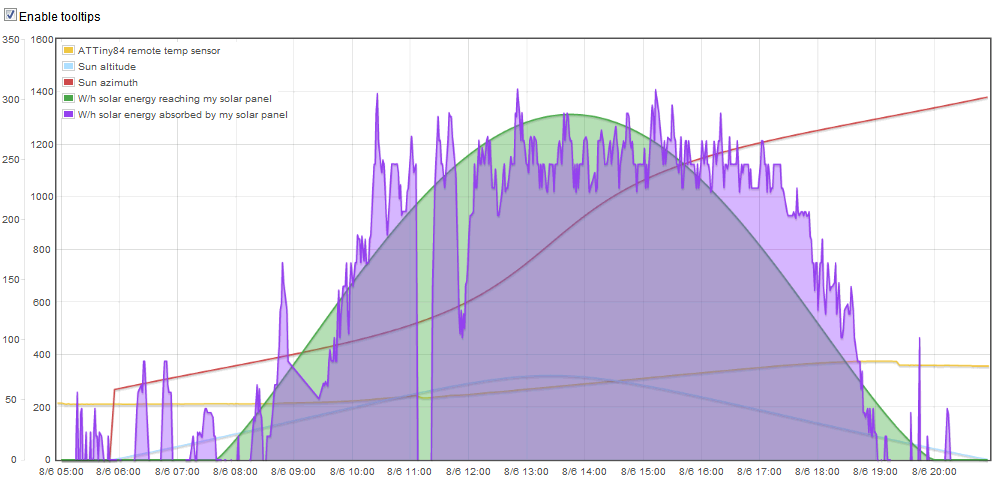
So I put up a PHP script that I run with a cron job every 5 minutes. The script sends Sun’s altitude, azimuth and calculated solar power that reaches my panel. I am now able to visualize that in emoncms.
Here is my code if someone is interested:
<?php
	// calculates the sun position and path throughout the day
	// input params: LAT&LON
	// output json

	// not much commenting in code
	// ported from http://www.stjarnhimlen.se/comp/tutorial.html
	// MANY THANKS!
	// most var-names are identical to above tutorial

//	$LAT = deg2rad($_GET["lat"]);
//	$LON = deg2rad($_GET["lon"]);

	$LAT = deg2rad(************************);
	$LON = deg2rad(************************);

	$year = gmdate("Y");
	$month = gmdate("m");
	$day = gmdate("d");
	$hour = gmdate("H") + (gmdate("i") / 60);

  // get current position
	getsunpos($LAT, $LON, $year, $month, $day, $hour, $azimuth, $altitude, $sunstate);

//Solar panel's tilt angle
	$modtilt=40;

//Solar panel's azimut
	$modazi=150;

//Solar panel's surface in sq. meters
	$modsufrace=2.088;

 	//The intensity of the direct component of sunlight throughout each day can be determined as a function of air mass
	//http://pveducation.org/pvcdrom/properties-of-sunlight/air-mass#formula
	$airmass=1/cos((90-$altitude)*4*asin(1)/360);

       //Sincident is the intensity on a plane perpendicular to the sun's rays in units of kW/m2 and AM is the air mass. The value of 1.353 kW/m2 is the solar constant and the number 0.7 arises from the fact that about 70% of the radiation incident on the atmosphere is transmitted to the Earth. The extra power term of 0.678 is an empirical fit to the observed data and takes into account the non-uniformities in the atmospheric layers.
	$Sincident=(1.353*pow(0.7,pow($airmass,0.678)));
       $fraction = cos($altitude*4*asin(1)/360)*sin($modtilt*4*asin(1)/360)*cos($azimuth*4*asin(1)/360-$modazi*4*asin(1)/360)+sin($altitude*4*asin(1)/360)*cos($modtilt*4*asin(1)/360);

	// kW/m² light intensity on the module * module's surface
	$Smodule = $Sincident * $fraction * $modsufrace;

	if( $altitude < 0 ) {
		$altitude=0;
   	       $azimuth=0;
		$Smodule=0;
	}

	echo "{\"result\":\"OK\",\"azimuth\":$azimuth,\"altitude\":$altitude,\"smodule\":$Smodule}";

	$url = "http://********.com/emon/api/post?apikey=**********************&json={\"azimuth\":$azimuth,\"altitude\":$altitude,\"smodule\":$Smodule}";

	//echo $url;
	$ch = curl_init();
	curl_setopt($ch, CURLOPT_URL,$url);
	curl_setopt($ch, CURLOPT_RETURNTRANSFER, 1);
	$contents = curl_exec ($ch);
	curl_close ($ch);

	die();

	function getsunpos($LAT, $LON, $year, $month, $day, $hour, &$azimuth, &$altitude, &$sunstate) {

	  // julian date
	$d = 367*$year - floor((7*($year + floor(($month+9)/12)))/4)
				 + floor((275*$month)/9) + $day - 730530;

	$w = 4.9382415669097640822661983551248
			 + .00000082193663128794959930855831205818* $d; // (longitude of perihelion)
	  $a = 1.000000                           ;//    (mean distance, a.u.)
	  $e = 0.016709 - .000000001151        * $d ;//   (eccentricity)
	  $M = 6.2141924418482506287494932704807
	  	 + 0.017201969619332228715501852561964 * $d ;//   (mean anomaly)

	$oblecl = 0.40909295936270689252387465029835
						- .0000000062186081248557962825791102081249 * $d  ;// obliquity of the ecliptic

	$L = $w + $M; // sun's mean longitude

	$E = $M + $e * sin($M) * (1 + $e * cos($M));

	$x = cos($E) - $e;
        $y = sin($E) * sqrt(1 - $e * $e);

	  $r = sqrt($x*$x + $y*$y);
	  $v = atan2( $y, $x )  ;

	  $lon = $v + $w;

	  $x = $r * cos($lon);
	  $y = $r * sin($lon);
	  $z = 0.0;

	  $xequat = $x;
	  $yequat = $y * cos($oblecl) + $z * sin($oblecl);
	  $zequat = $y * sin($oblecl) + $z * cos($oblecl);

		$RA   = atan2( $yequat, $xequat );
	  $Decl = asin( $zequat / $r );

		$RAhours = r2d($RA)/15;

	  $GMST0 = r2d( $L + pi() ) / 15;//
	  $SIDTIME = $GMST0 + $hour + rad2deg($LON)/15;

		$HA = deg2rad(($SIDTIME - $RAhours) *15);

		$x = cos($HA) * cos($Decl);
	  $y = sin($HA) * cos($Decl);
	  $z = sin($Decl);

	  $xhor = $x * cos(pi()/2 - $LAT) - $z * sin(pi()/2 - $LAT);
	  $yhor = $y;
	  $zhor = $x * sin(pi()/2 - $LAT) + $z * cos(pi()/2 - $LAT);

	  $azimuth = rad2deg(atan2( $yhor, $xhor ) + pi());
	  $altitude = rad2deg(asin( $zhor ));

	}

	function r2d($r) {
		$d = rad2deg($r);
		while ($d<0) $d += 360;
		while ($d>360) $d -= 360;
		return $d;
	}

?>


Wow! Cool hack! do you have a screen shot of that graph vs the actual yield?
Thanks,
my system is for heating water, look up “non-pressurized evacuated tube solar water heater” in Google to see what I mean.
It is going to be quite a challenge for me to measure the actual yield, though I do have some rough ideas. The problem is that it is basically a hot water tank that is used all day long, and cold water is being fed into it whenever it is used. My idea is to measure increases of temperature and knowing the tank’s volume and what energy it takes to heat up that volume by one degree Celsius (1.163W/h per liter) , I may be able to get rough idea on the energy that has been absorbed.
Also, I am not sure what the efficiency of these solar tubes is, I read on the Internet that they are somewhere from 45-70% depending on the model.
For PV modules it is another story, you can easily measure the output and compare to the projections.
It has been completely bad overcast weather for the last 10 days where I live and I don’t have any interesting charts to show yet. I overlay Sun’s altitude, azimuth and the calculated energy that falls on the solar panel, but it would be lovely to see these once the weather clears up a bit.
I use the multigraph in emoncms for the purpose.
Dear Martin,
I captured your script and I have it working at my emoncms installation. nice job for making this script!
But I have an small question, can you explain how to use the emoncms 3 inputs from this script (altitude,azimut,smodule) for making an nice graphic? I setup 3 log feeds for it…. mayby you have an example page script?
I use emoncms’s multigraph, here is what I have :
Note that the calculation is for flat panels, whereas I have evacuated tubes that are a kind of passive solar tracker, thus they reach maximum yield much faster.
Hi,
I’m trying to use/implement you’re function, but i get negative values.
My Solar panels are at azimuth 270 and Tilt 30 and get these values:
Time Azimuth Altitude Airmass
05:21 48 -1 0
06:00 56 4 -1.2555
06:30 62 8 -2.5338
07:00 67 12 -2.9875
07:30 73 16 -2.9251
08:00 78 21 -2.2257
08:30 84 25 -1.39
09:00 90 30 0
09:30 96 35 1.6541
Are these values correct and if the are correct, how do i read them?
– Marco
Hi Marco, the air mass can be anything between plus infinity and 1, I am not sure how you got negatives when the formula for air mass is $airmass=1/cos((90-$altitude)*4*asin(1)/360);
please double-check. As a final result you need the Smodule from the above code, the air mass is just necessary for intermediate calculations.
Read here: http://pveducation.org/pvcdrom/properties-of-sunlight/air-mass
Hi,
I Created the following function, which returns the $Smodule:
function airmass($altitude,$azimuth){
//Solar panel’s tilt angle
$modtilt=30;
//Solar panel’s azimut
$modazi=270;
//Solar panel’s surface in sq. meters
$modsufrace=1;
//The intensity of the direct component of sunlight throughout each day can be determined as a function of air mass
$airmass=1/cos((90-$altitude)*4*asin(1)/360);
$Sincident=(1.353*pow(0.7,pow($airmass,0.678)));
$fraction = cos($altitude*4*asin(1)/360)*sin($modtilt*4*asin(1)/360)*cos($azimuth*4*asin(1)/360-$modazi*4*asin(1)/360)+sin($altitude*4*asin(1)/360)*cos($modtilt*4*asin(1)/360);
$Smodule = $Sincident * $fraction * $modsufrace;
if( $altitude < 0 ) {
$altitude=0;
$azimuth=0;
$Smodule=0;
}
return $Smodule;
}
If you email me, i can sent you the link where the data can be found.
– Marco
My final code also is a bit different from the one in the post, I added one extra check for SModule <0 in early /late day just around sunrise and sunset.
Also, In my Final code I do Whm2 and not KWhm2 (note the *1000)
// W/m² light intensity on the module * module's surface
$Smodule = $Sincident * $fraction * $modsufrace * 1000;
if($Smodule<0) $Smodule=0;
if( $altitude < 0 ) { $altitude=0; $azimuth=0; $Smodule=0; } Also, cross check your SUN altitude and azimuth calculation with Wolfram Alpha, just type "sun altitude,azimuth" there and it will calculate it for your position (based on your IP) and current time. See how it graphs for me: http://harizanov.com/wp-content/uploads/2012/06/solar_yield.png
also your calculation for 9:30 i a bit strange, I get 0.0719164783402 (in kWhm2) for azimuth 96 altitude 35
http://harizanov.com/suncalc.php?altitude=35&azimuth=96
I just added:
$altitude = $_GET[‘altitude’];
$azimuth = $_GET[‘azimuth’];
echo airmass($altitude,$azimuth);
and a check if $Smodule is <0
I made a typo in the table header..
Here’s is the good table with headers;
Tijd; Azimuth; Altitude; Watt light intensity;
05:21; 4; -1; 0;
05:30 50 0 0
05:45 53 2 -357.4214
06:00 56 4 -1255.4524
06:15 59 6 -2008.2708
06:30 62 8 -2533.8195
06:45 64 10 -2825.1369
07:00 67 12 -2987.5334
07:15 70 14 -3014.3336
07:30 73 16 -2925.1461
07:45 75 19 -2534.0616
08:00 78 21 -2225.6631
08:15 81 23 -1842.0977
08:30 84 25 -1390.0034
08:45 87 28 -588.3066
09:00 90 30 0
09:15 93 32 637.9128
09:30 96 35 1654.079
Where do the negative values stand for?
Ignore the negative values, these are received when light angle is such that it would fall on the back of the panel, messing up the formulas. We are interested only in real life situation, therefore I added a check to only show positive values, see my earlier comment.
So basically the sun rises at East and it needs some time before it can cast some light on your panel.
if($Smodule<0) $Smodule=0;
Thanx! i implemented you’re bugfix and going to insert all the data in my database 🙂
Thanx for this calculation and you’re work/time!
-Marco
Pingback: Using my 1.8 TFT as a Raspberry Pi status display | Martin's corner on the web