The comments to my last blog post got me thinking if I had chosen the right RFM channel at home, obviously if the channel is noisy that directly affects reception and increases the error rates. I use the default 868Mhz setting for the RFM12B/RFM69s at home and decided to check if the channel is clear from other transmissions. I remembered seeing a RFM12B spectrum analyzer project over at Jeelab some years ago, and 5 minutes later was running the spectrum analyzer using one of my Funky v3s equipped with a 868Mhz RFM12B.
The result is as follows:
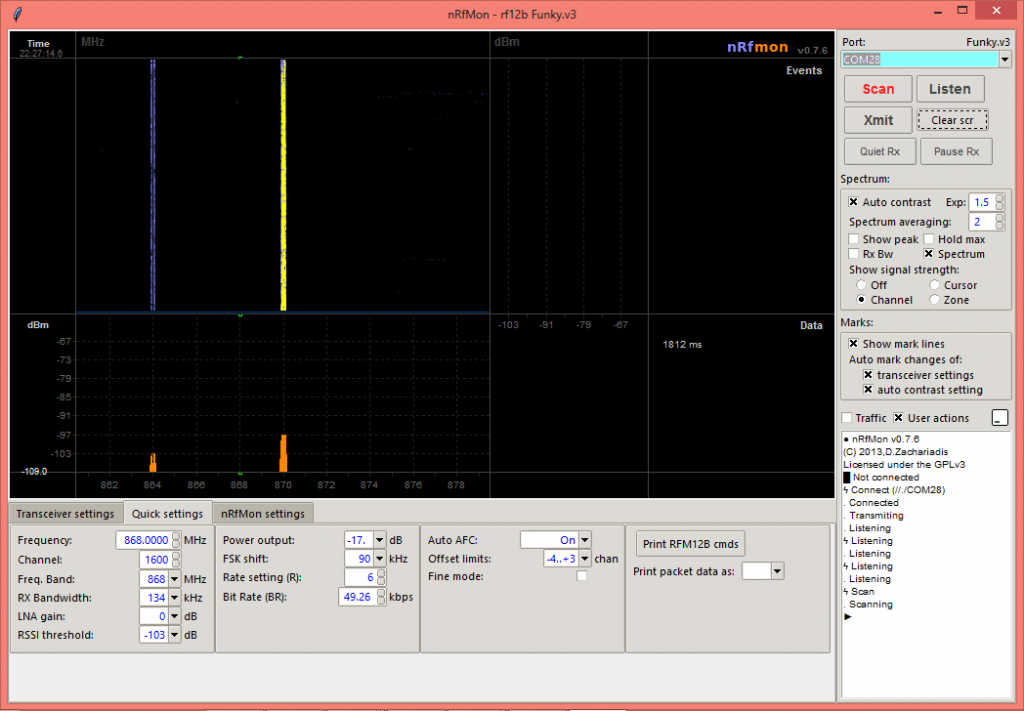
There are strange peeks at 864 and 870Mhz, the signal level is weak, less than -97dBm, but other than that it is very clean spectrum. And no wonder, I live in a small suburban village. That’s good result, the default 868Mhz band seems clear. I was curious about the two peaks and took another scan at my office in downtown Sofia, the result is much noisier spectrum, but oddly the peaks are there too, in fact couple more are clearly visible as well plus a faint trace of third one:
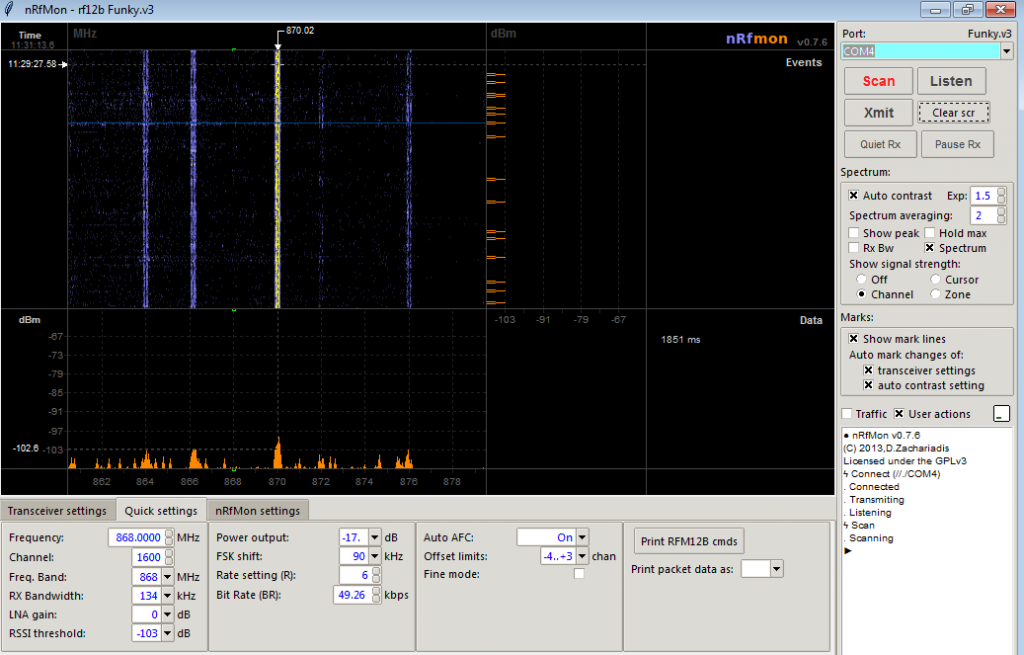
Most probably these are harmonics from DVB-T or other strong signal, but the area around 868Mhz seems clear both in the city and at home. Good to know. Scanning the spectrum and choosing a free channel to use is an effort well worth when initially setting up a wireless sensor network.