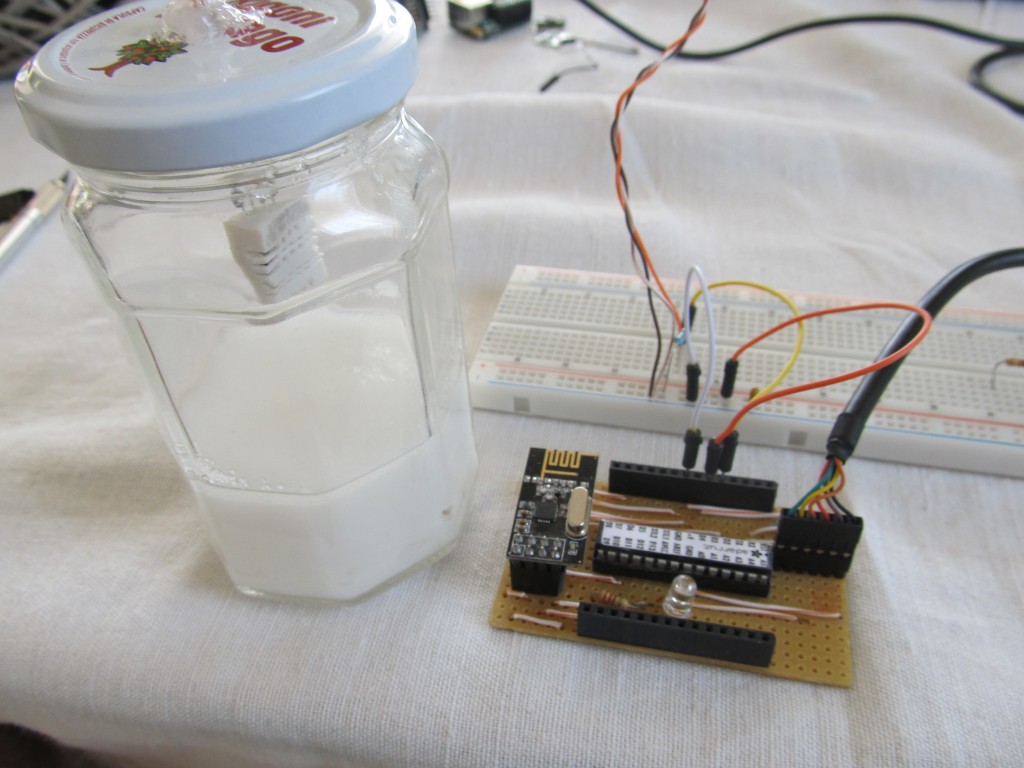
I have measured the relative humidity as per my set up, and got steady readouts exactly in the 75% area as expected:
DHT22 Library Demo
Requesting data...Got Data 25.50C 75.20%
Integer-only reading: Temperature 25.5 C, Humidity 75.2 % RH
Requesting data...Got Data 25.50C 75.20%
Integer-only reading: Temperature 25.5 C, Humidity 75.2 % RH
Requesting data...Got Data 25.50C 75.30%
Integer-only reading: Temperature 25.5 C, Humidity 75.3 % RH
Requesting data...Got Data 25.50C 75.40%
Integer-only reading: Temperature 25.5 C, Humidity 75.4 % RH
Requesting data...Got Data 25.60C 75.40%
Integer-only reading: Temperature 25.6 C, Humidity 75.4 % RH
Requesting data...Got Data 25.50C 75.40%
Integer-only reading: Temperature 25.5 C, Humidity 75.4 % RH
Requesting data...Got Data 25.60C 75.30%
Integer-only reading: Temperature 25.6 C, Humidity 75.3 % RH
Requesting data...Got Data 25.60C 75.30%
Integer-only reading: Temperature 25.6 C, Humidity 75.3 % RH
Requesting data...Got Data 25.60C 75.20%
Integer-only reading: Temperature 25.6 C, Humidity 75.2 % RH
Requesting data...Got Data 25.60C 75.10%
Integer-only reading: Temperature 25.6 C, Humidity 75.1 % RH
Requesting data...Got Data 25.60C 75.00%
Integer-only reading: Temperature 25.6 C, Humidity 75.0 % RH
Requesting data...Got Data 25.60C 75.00%
Integer-only reading: Temperature 25.6 C, Humidity 75.0 % RH
Requesting data...Got Data 25.60C 74.90%
Integer-only reading: Temperature 25.6 C, Humidity 74.9 % RH
Requesting data...Got Data 25.70C 74.80%
Integer-only reading: Temperature 25.7 C, Humidity 74.8 % RH
So that means the DHT22 is accurate, good to know 🙂
Nice work!
The saturation shown in the graphs (99.99%) might be due to condensation forming inside the DHT22 module. Once dew forms, the RH value will probably stay at 99.99% until it evaporates again. That could explain why the humidity curve looks like it’s been clipped at the top.
I am also thinking if it makes a difference between having the DHT22 constantly powered vs powering it just for two seconds and taking a measurement.
Did you solve the morning dew issues you had? Iam currently planning to use this sensor outside of my house but iam not yet sure what housing to use.
It is much better now that it is summer as humidity is low. It may be normal reading for my location, I live next to a large forest
About six months ago I was searching the web for anyone who had done this experiment and found nothing, so I decided to do it myself. I see now that you were actually thinking along the same lines at almost exactly the same time.
Here’s my write up, wildly more verbose than yours and in need of heavy editing.
http://www.kandrsmith.org/RJS/Misc/calib_dht22.html
The experiment is still ongoing, but my conclusions are similar yours. These devices are amazingly good for the price. The maximum errors I have measured are about 6% RH, with typical errors of 2-3% RH. I see quite a strong temperature dependence of at least 2% RH over the temperature range I have tested so far; still working on that. I have not done any long term tests, but on timescales of a few weeks I find repeatability in the range 0.5-1% RH.
I am glad to see someone else unwilling to just trust the data sheet and test it for them self.
RJS
Robert, you have done some impressive analysis, thanks for sharing! I am pretty happy with these too, my DHT22+Funky project is running for over a year now, collecting data every 5 min. I changed the battery last week, this makes slightly over a year on single AAA battery.
You can make the DHT22 even more accurate, up to 99.9% by calibrating it with a precise temp/Rh logger, like an Onset HOBO U12. You can do this by getting a week of data at regular intervals, say every 1 min or 5 mins, from both the DHT22 and the HOBO. Creating a scatter plot in excel between the two gives the line equation, along with the R-value. Now you can use this equation in your microprocessor code to convert every value read from the DHT22 sensor into a more accurate one.
I’m dealing with DHT22 readings that are bouncing around faster than is believable. I’m wondering how long you leave your DHT powered on for this test (or whether it’s continuously powered), and on what interval you’re taking readings.
I’m thinking that self-heating may be causing my readings to vary a bit.