A local forum guy asked me to help him setup a system that logs his solar hot water tank and few other temperatures. The thing is he wasn’t sure how many temperature sensors he’d use and wanted to expand as he needs to, but he isn’t familiar with Arduino programming. So, I decided to put up a small sketch that would utilize the Sensing Shield ontop an Arduino Ethernet, and the end product should be pretty much plug-and-play. If more sensors (DS18B20) were attached to the one-wire bus, they would be discovered and their readings sent to Pachube (now known as cosm.com).
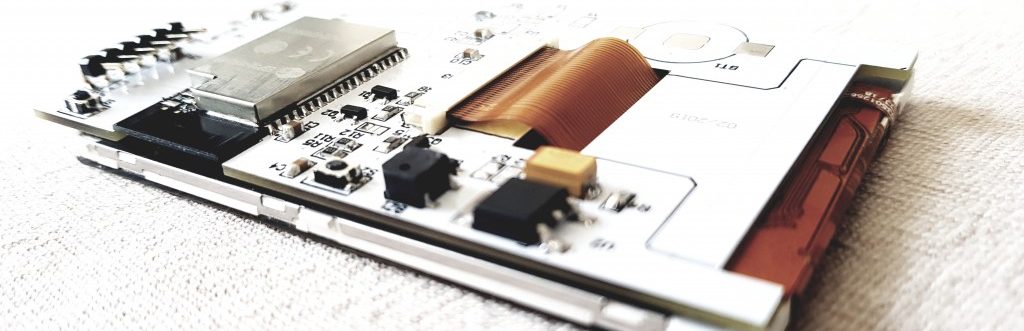
So here is the result, a test sensor is connected to the OneWire port:

His particular need is to track temperatures only, so no other components were soldered.
Another requirement was to use Pachube.com for logging, since it is free and reliable. However, the in-built graphs didn’t offer overlaying the temperatures (the new version http://cosm.com seems to have better approach) and I googled a solution for overlaying three temperature readings on a chart:

The code for the chart is quite simple:
<!DOCTYPE html PUBLIC "-//W3C//DTD XHTML 1.0 Strict//EN" "http://www.w3.org/TR/xhtml1/DTD/xhtml1-strict.dtd">
<html xmlns="http://www.w3.org/1999/xhtml">
<head>
  <meta http-equiv="content-type" content="text/html; charset=utf-8" />
  <title>Pachube Viz - Preview</title>

</head>
<body style="font-family: Arial;border: 0 none;">

<b>This is a preview of your embedded code:</b><br /><br />

<script type="text/javascript" src="http://www.google.com/jsapi"></script>
<script language="JavaScript" src="http://apps.pachube.com/google_viz/viz_multi.js"></script>
<script language="JavaScript">createViz([57665,57665,57665],[1,3,4],800,400,["ff0000","0000ff","00ff00"]);</script>

</body>
</html>
The Arduino sketch is available on github